How I optimized Java Swing pixel drawing in terms of CPU, memory, and GPU
In this post, I’ll show you how I optimize code in fun and interesting way.
I was in the process of creating NES emulator. For those who don’t know, Nintendo Entertainment System (NES) is a game console that was released in 1983. It was the first console that was popular in the US. It was the console that made Mario and Zelda popular.
I am currently working on developing an NES emulator, which is a fancy word for running NES on a computer. I am writing it in Java.
You can take a look at this project here.
For now, I am working on PPU scrolling and foreground (sprite) rendering. Here is a gif of my current progress (the game is Donkey Kong and I which only renders background tiles):
But before I can implement PPU scrolling and sprite rendering, I am trying to squash CPU and memory regressions.
The problem
I was using the following code to draw pixels on the screen:
    public void draw_frame(Graphics g, int width, int height) {
        for (int tile_row = 0; tile_row < 30; tile_row++) {
            for (int tile_col = 0; tile_col < 32; tile_col++) {
                draw_tile(g, pixel_width, pixel_height, tile_row, tile_col);
            }
        }
    }
    ...
    private void draw_tile(Graphics g, int pixel_width, int pixel_height, int tile_row, int tile_col) {
        ...
        for (int pixel_row = 0; pixel_row < 8; pixel_row ++) {
            for (int pixel_col = 0; pixel_col < 8; pixel_col++) {
                    g.fillRect(
                        (tile_col * 8 + (7- pixel_col)) * pixel_width,
                        (tile_row * 8 + pixel_row) * pixel_height,
                        pixel_width,
                        pixel_height);
            }
        }
    }
It seems fine, but we have 32x30 tiles, each tile is 8x8 pixels, so we have 32x30x8x8 = 61440 pixels to draw. This is quite a lot of pixels for each frame. And NES runs at 60 frames per second, so we have 61440x60 = 3,686,400 pixels to draw per second.
I’m running the donkey kong game with Intellij profiler and saw that AWT-EventQueue thread takes 25% of the CPU time, and AWT-Windows take 22.6% of the CPU time:
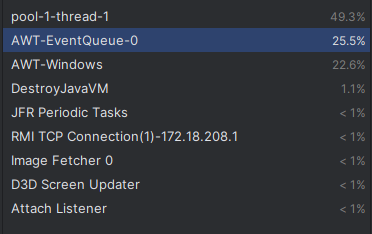
This shows the amount of CPU time spent on each thread.
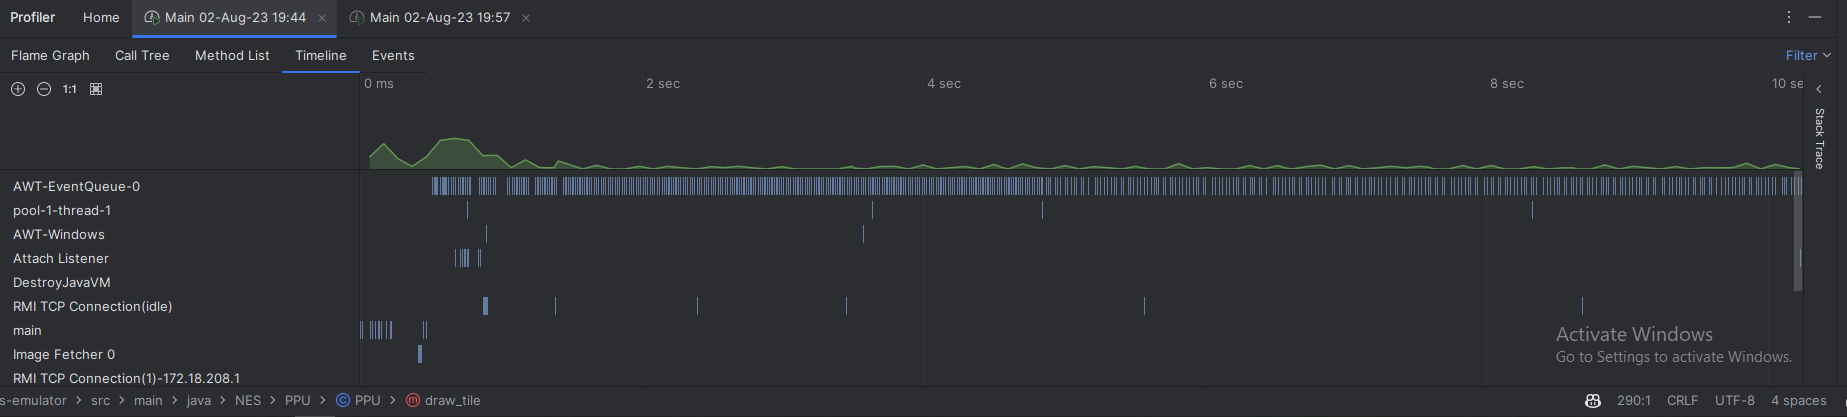
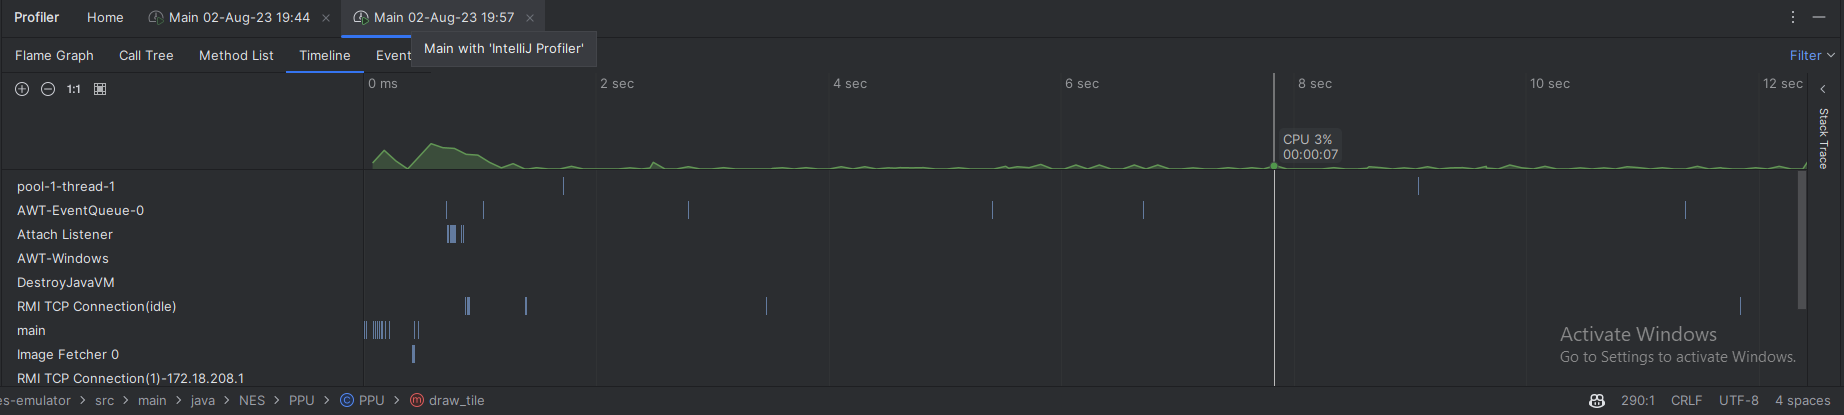
And the timeline:
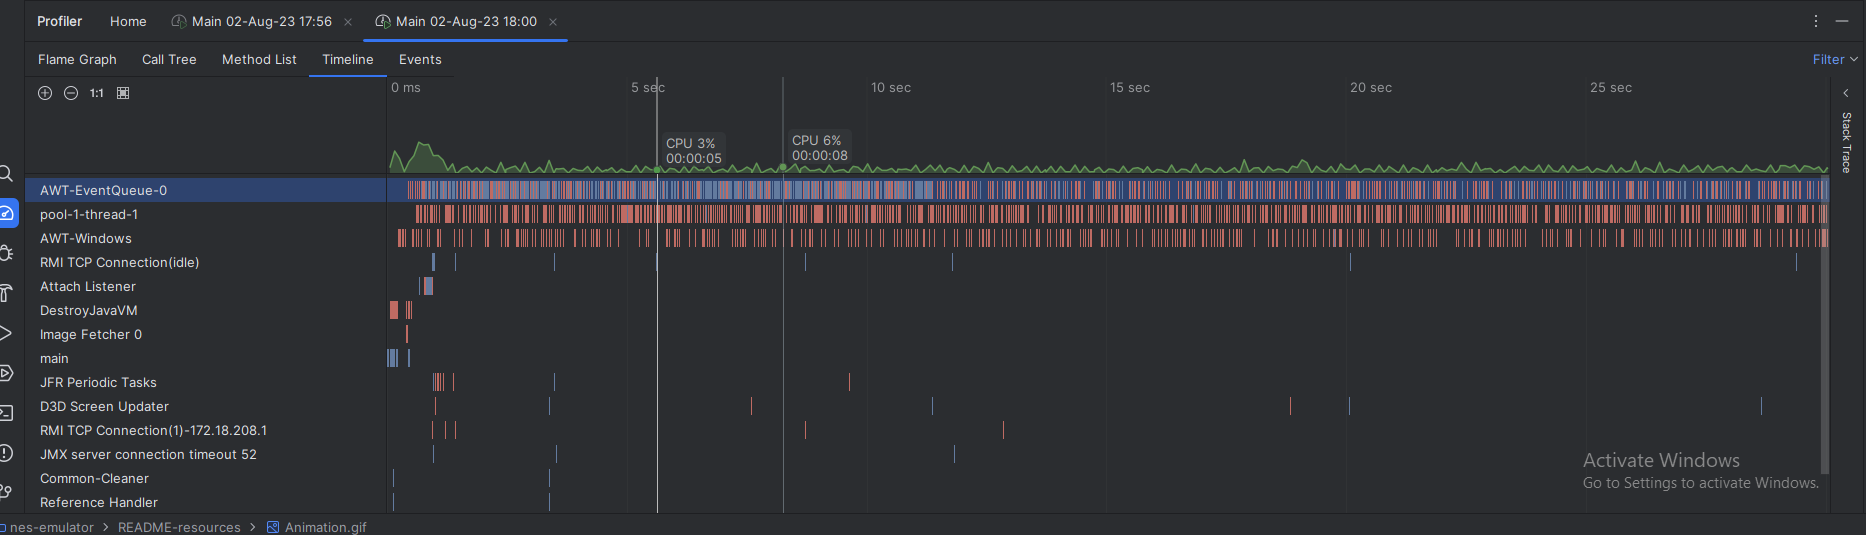
- The green graph shows the CPU load
- Each row represents a thread (for example, a thread with the name
AWT-EventQueuehas a lot of events/calls throughout the timeline, showcased in red color) - The blue color represents memory allocation events (the first thread has most of the memory allocation events)
The optimization
I decided to use BufferedImage. It is a class that represents an image in memory. It has a method setRGB that allows to set the color of a pixel.
More importantly, it is efficient. We don’t need to immediately draw the image onto the screen, but we can buffer it in an array, and draw that array instead.
Not only that, but it also allows affine transformations, which allows me to scale the image to the size of the screen without having to do any calculations. We can also add effects like rotation, shearing, etc.
Here is some of the code I used:
    public PPU(...) {
        ...
        /*
        Each pixel color is 2 bits (0, 1, 2 or 3), which is index inside specific palette.
        There are 64 colors in total.
        Each color is represented by 3 bytes (red, green, blue).
         */
        this.indexColorModel = new IndexColorModel(2, 64, red, green, blue);
        this.bufferedImage = new BufferedImage(256, 240, BufferedImage.TYPE_BYTE_INDEXED, indexColorModel);
    }

    public void draw_frame(Graphics g, int width, int height) {
        for (int tile_row = 0; tile_row < 30; tile_row++) {
            for (int tile_col = 0; tile_col < 32; tile_col++) {
                draw_tile(tile_row, tile_col);
            }
        }
        g.drawImage(bufferedImage, 0, 0, width, height, null);
    }

    private void draw_tile(int tile_row, int tile_col) {
        ...
        bufferedImage.setRGB(
                        (tile_col * 8 + (7- pixel_col)),
                        (tile_row * 8 + pixel_row),
                        c.getRGB());
    }
The result:
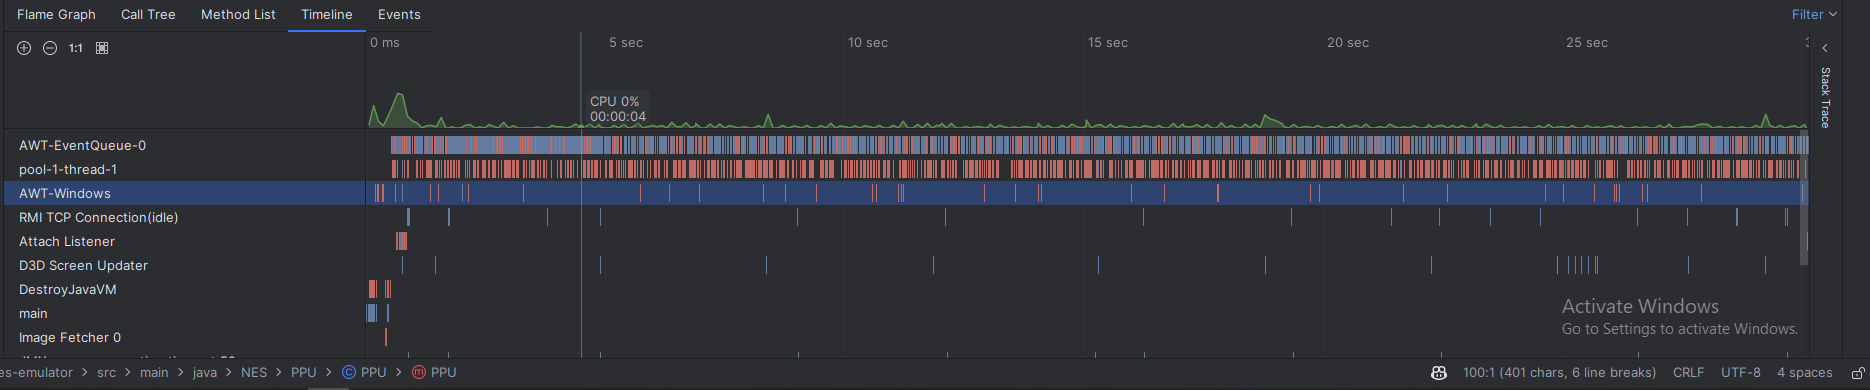
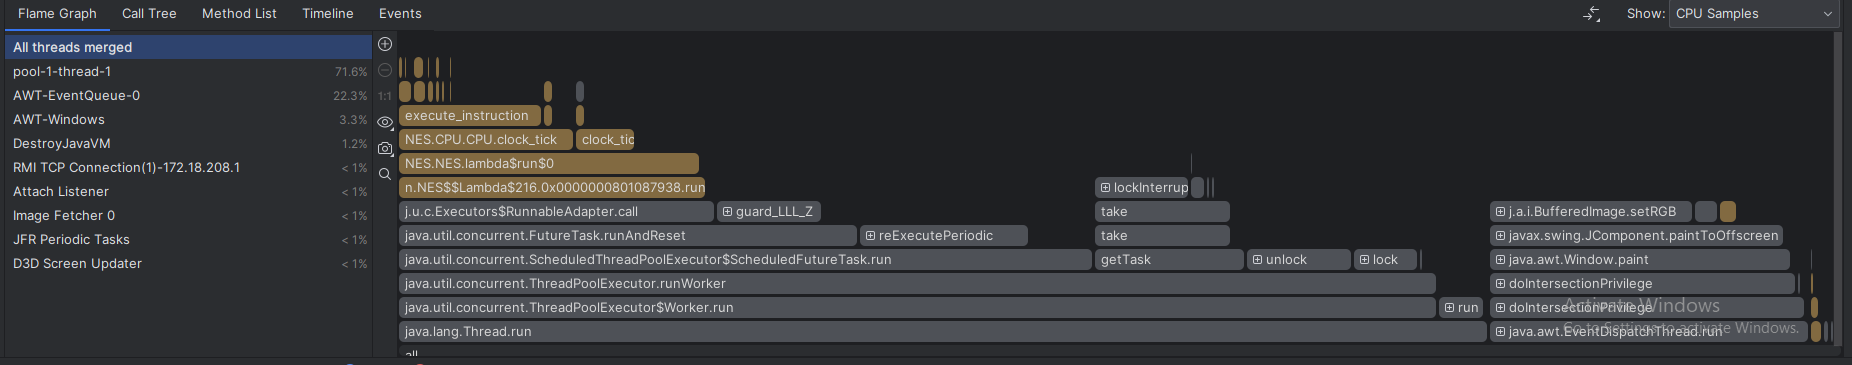
Basically we completely reduced the time of AWT-Windows thread from 22.6% to 3.3%, and reduced the time of AWT-Event-Queue by 3%.
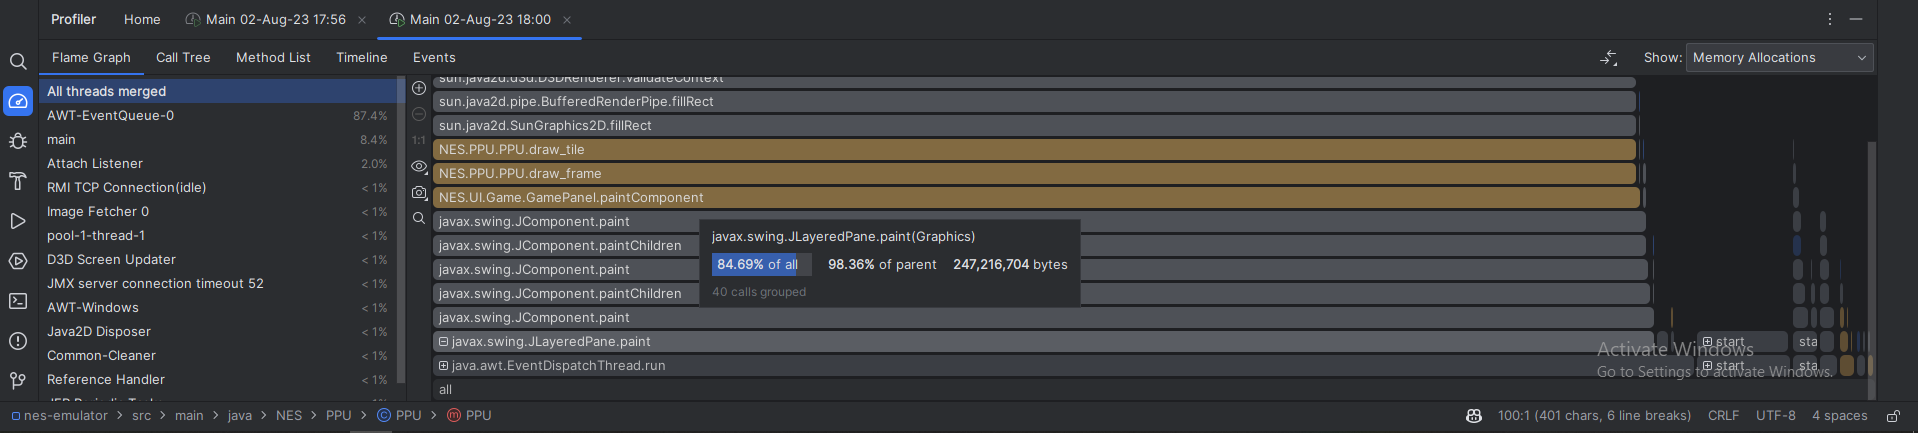
If we look at the memory allocation, before:
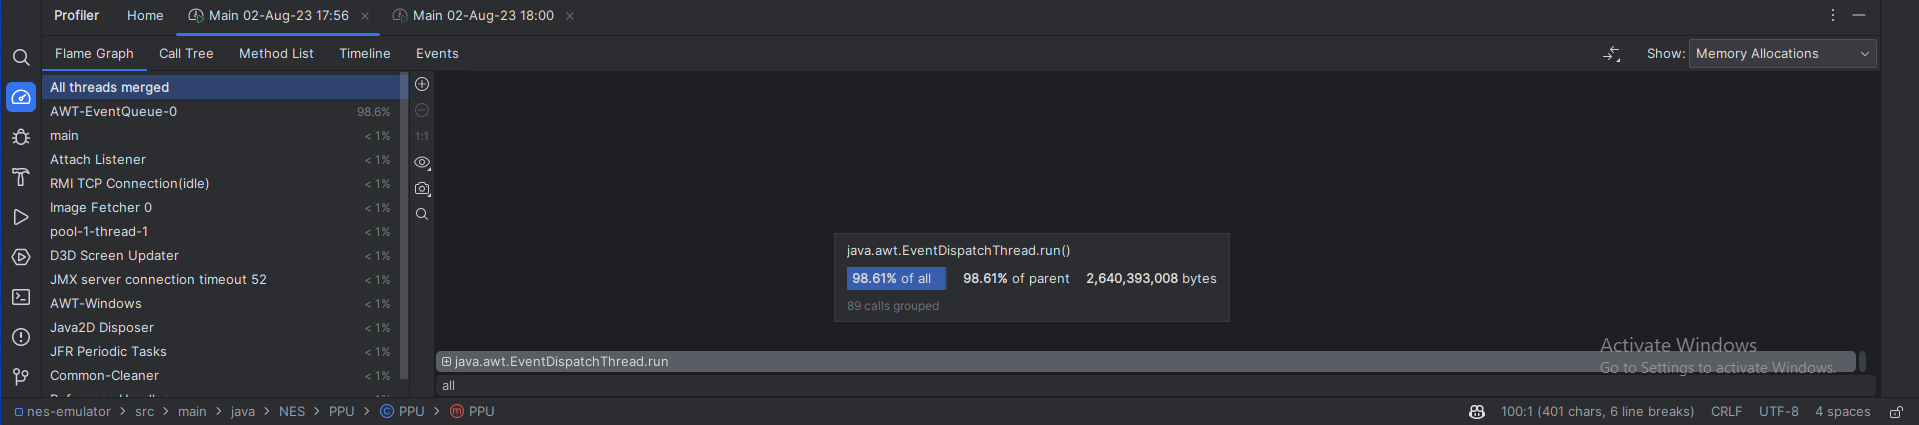
And after:
We can see that before, we allocated 95% of AWT-EventQueue thread in the draw_tile function, because of the fillRect calls.
After the optimization, we don’t allocate anything in AWT-EventQueue. All the allocations are done in the thread EventDispatchThread.
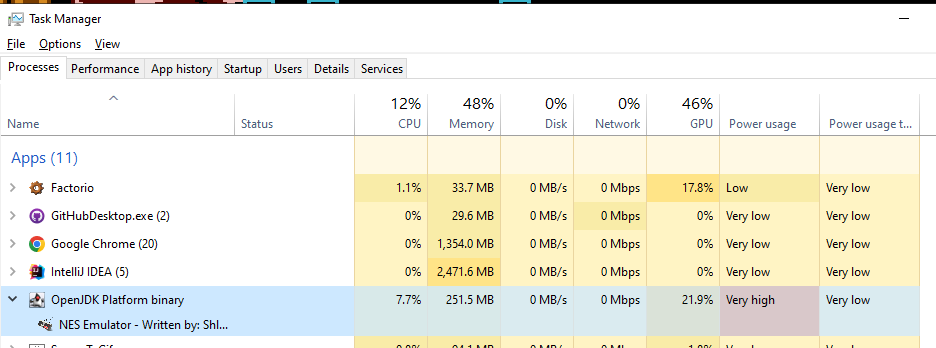
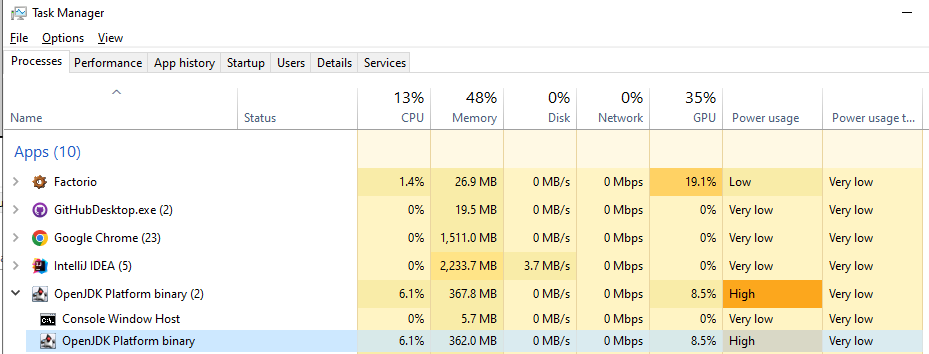
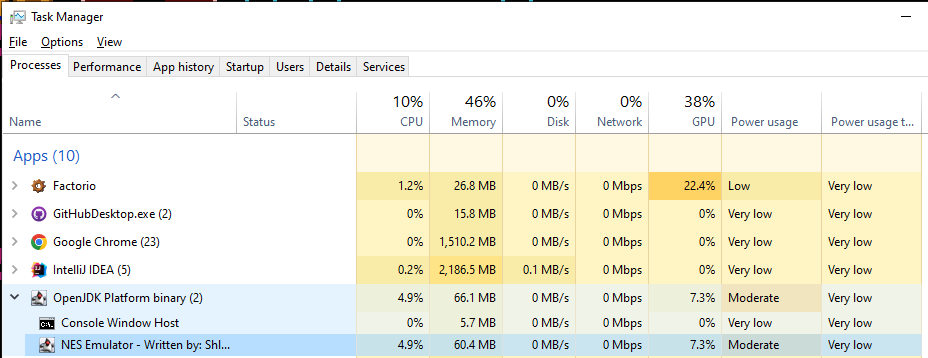
In terms of real-world performance, checking the task manager, before the optimization:
After:

- CPU went down from 7.2% to 4.2%
- Memory increased from 251MB to 356MB - which is quite surprising (I will explain how I managed to significantly reduce it in the next section)
- The GPU went down from 22% to 7%, which is significant.
The second optimization
I was happy with the CPU load but the memory allocation was too high. So I decided to optimize it again.
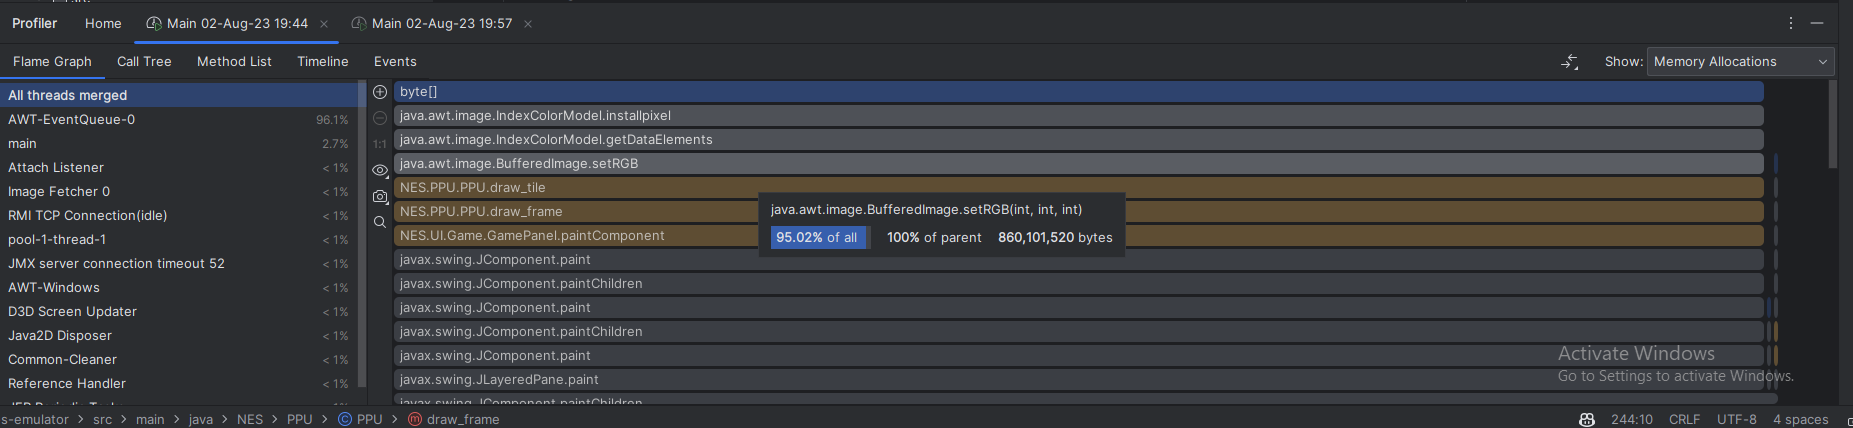
I noticed that setRGB() function is responsible for 95% (!) of all memory allocations events in all of the merged threads. Having a closer look at this function reveals why:
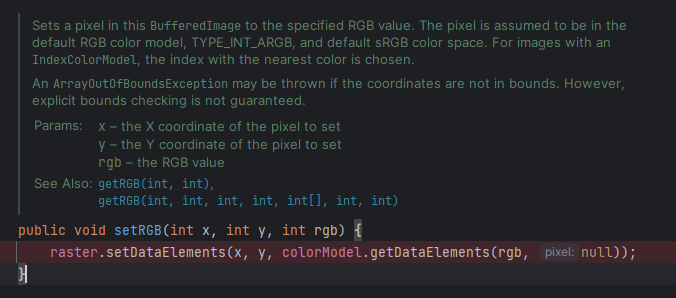
Looking deeper we can see that for each setRGB we call IndexColorModel.getDataElements(), with the purpose to get the pixel color from given index. Inside it allocates 1 byte array:

In other words, each second we allocate 3,686,400 bytes (3.5MB) of memory, which is quite a lot.
So I decided instead of using this function, I must access the low-level buffered data of the BufferedImage and set the pixel myself.
BufferedImage uses Raster to store and retrieve pixel data. Raster is an abstract class that represents raster image (pixel base, there are other options like vector images that are represented as mathematical equations and curves). Anyway, BufferedImage has a method getRaster() that returns the raster of the image. And we can now access the setPixel method:
                int pixel_x = tile_col * 8 + (7- pixel_col);
                int pixel_y = tile_row * 8 + pixel_row;

                int color_index_in_system_palette = color_row * 16 + color_col;

                buffered_pixel_color[0] = color_index_in_system_palette;
                bufferedImage.getRaster().setPixel(pixel_x, pixel_y, buffered_pixel_color);
Where buffered_pixel_color is array of size 1, which represent the color index that we use from IndexColorModel. Why is it array and not an integer? Because we can also represent ColorModel using tuple of numbers instead of index, like RGB.
The result (before optimization we have a lot of memory allocations, in blue):
After:
Bonus
For the interested reader, that wonder how I implemented precise clock timing for CPU, PPU clock ticks, I used ScheduledExecutorService.
In NES, the CPU clock speed is 1.79MHz, and the PPU clock speed is 5.37MHz (3 times as fast). Both run synchronously. That means each clock cycle of the CPU is 559 nanoseconds, and each clock cycle of the PPU is 186 nanoseconds. I implemented it like this:
    public void run() {
        is_running = true;

        ScheduledExecutorService executor = Executors.newScheduledThreadPool(1);
        executor.scheduleAtFixedRate(() -> {
            if(!is_running)
                executor.shutdown();

            cpu.clock_tick();
            ppu.clock_tick();
            ppu.clock_tick();
            ppu.clock_tick();
        }, 0, 559, TimeUnit.NANOSECONDS);
    }
Conclusion
In the first optimization, I was able to optimize the pixel drawing by 42% in terms of CPU time, and 68% in terms of GPU time. However the memory went up by 30%.
In the second optimization, I was able to reduce the memory allocation by 81%.
In total I reduced memory by 76%, the CPU by 36% and GPU by 66%.
It is important to know how to analyze the profiling analytics and dig deeper how to optimize the code. This post demonstrates how I optimize code, and it shows that it can also be fun.